


Stock Ideas 💡 - 27 May 2024
Stock Ideas handpicked saving you from wasting time and analysis paralysis.
Hello! 👋
Welcome to some interesting stock ideas for this week.
What is Stock Ideas💡 and who is it for? Refer here - Introduction to Stock Ideas 💡
Save the hassle of going through a list of 1500+ stocks and creating a final list of 10-15 stocks also doing fundamental research on the same every single week.
None of the stock ideas are Buy/Sell recommendation as they are no entry or exit prices mentioned.
It is purely for idea generation and prevent mundane screening every week so you can focus on better things.
This series will present you with the best momentum stocks that can be in the traded/ invested from timeframe of few weeks to even couple of months.


Honasa Consumer Ltd

Revenue of 1395 Cr FY23 vs 1764 Cr. FY24 - 👍
PAT of (121) Cr vs 121 Cr FY24 - 👍
EPS of (8.84) vs 3.73 FY24
Cashflow positive.
Looking at the technical standpoint -
Fresh breakout and retesting.
Showing strength in price.
Sheetal Cool Products Ltd.


Revenue of 340 Cr FY23 vs 353 Cr. FY24 - 👍
PAT of 20 Cr FY23 vs 21 Cr FY24 - 👍
EPS of 19.48 FY23 vs 19.85 FY24 - 👍
Cashflow positive.
Looking at the technical standpoint -
Good volumes on weekly timeframe
Alicon Castalloy Ltd.


Good volume picking up in the weekly timeframe.
Revenue of 1401 Cr FY23 vs 1559 Cr. FY24 - 👍
PAT of 51 Cr FY23 vs 61 Cr FY24 - 👍
EPS of 31.91 FY23 vs 38 FY24 - 👍
Symphony Ltd

Good consolidation for a long time and volumes are picking back up.
Revenue of 1188 Cr FY23 vs 1156 Cr. FY24
PAT of 116 Cr FY23 vs 148 Cr FY24 - 👍
EPS of 16.64 FY23 vs 21.46 FY24 - 👍
Welspun Enterprises Ltd

Good strength in price and supporting volume.
Revenue of 2758 Cr FY23 vs 2872 Cr. FY24 - 👍
PAT of 726 Cr FY23 vs 319 Cr FY24 - 👍
EPS of 48.19 FY23 vs 21.32 FY24 - 👍
There was a huge spike in FY23 is only because of “Other Income” which was a one time.

Cheviot Company Ltd
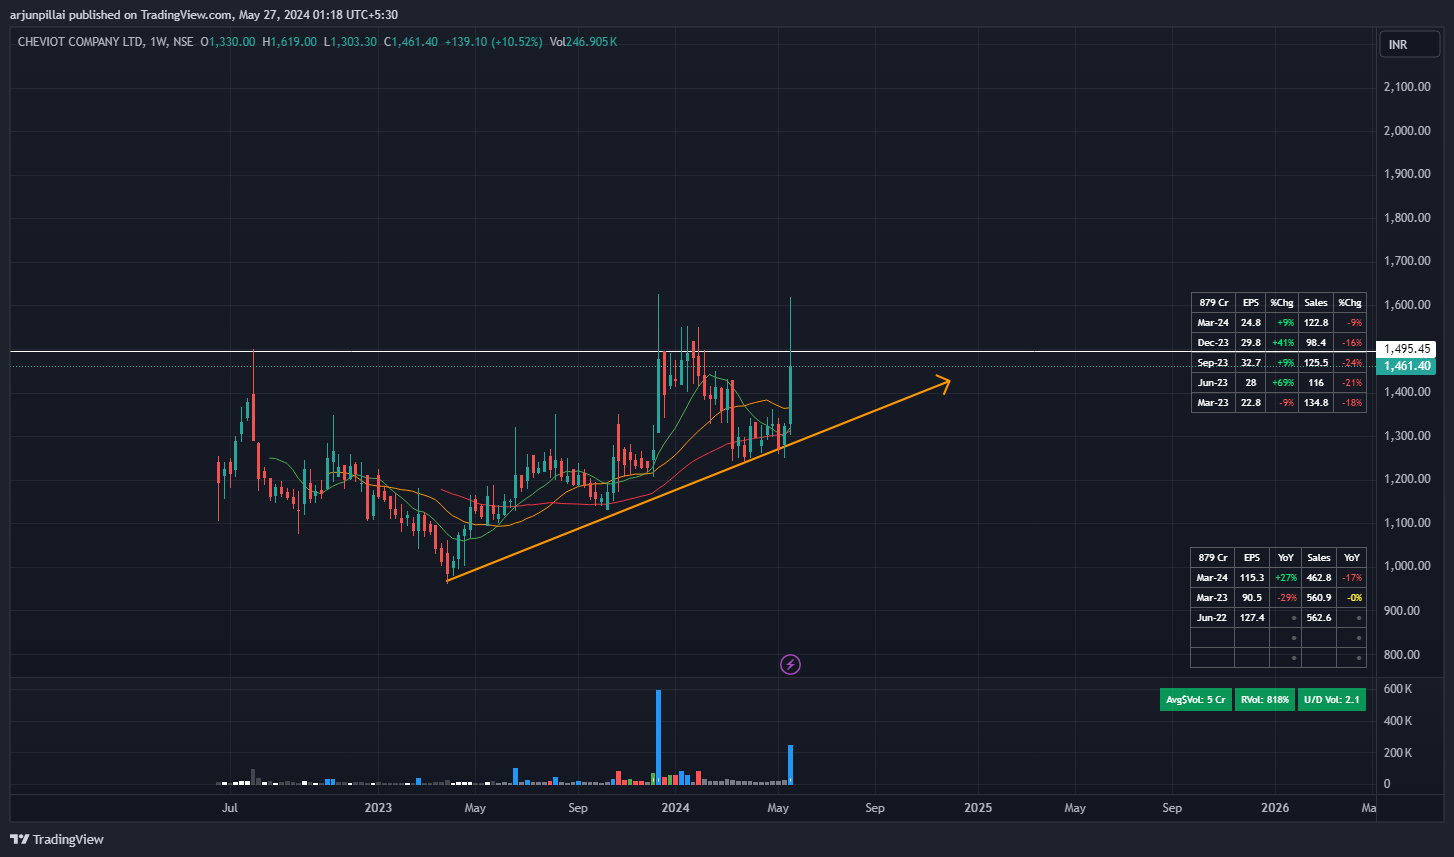
Weekly volumes spike up. Huge inflow of volumes and continues to recover.
Revenue of 564 Cr FY23 vs 463 Cr. FY24 - 👎
PAT of 54 Cr FY23 vs 69 Cr FY24 - 👍
EPS of 90.51 FY23 vs 115.33 FY24 - 👍
NRB Bearings Ltd

Results will be announced on 27th May (Today)
Good price action and consolidation going towards resistance.
Revenue of 1057 Cr FY23 vs 1122 Cr. TTM - 👍
PAT of 96 Cr FY23 vs 245 Cr TTM - 👍
EPS of 9.7 FY23 vs 25.05 TTM - 👍
Cashflow positive.
Finolex Cables Ltd
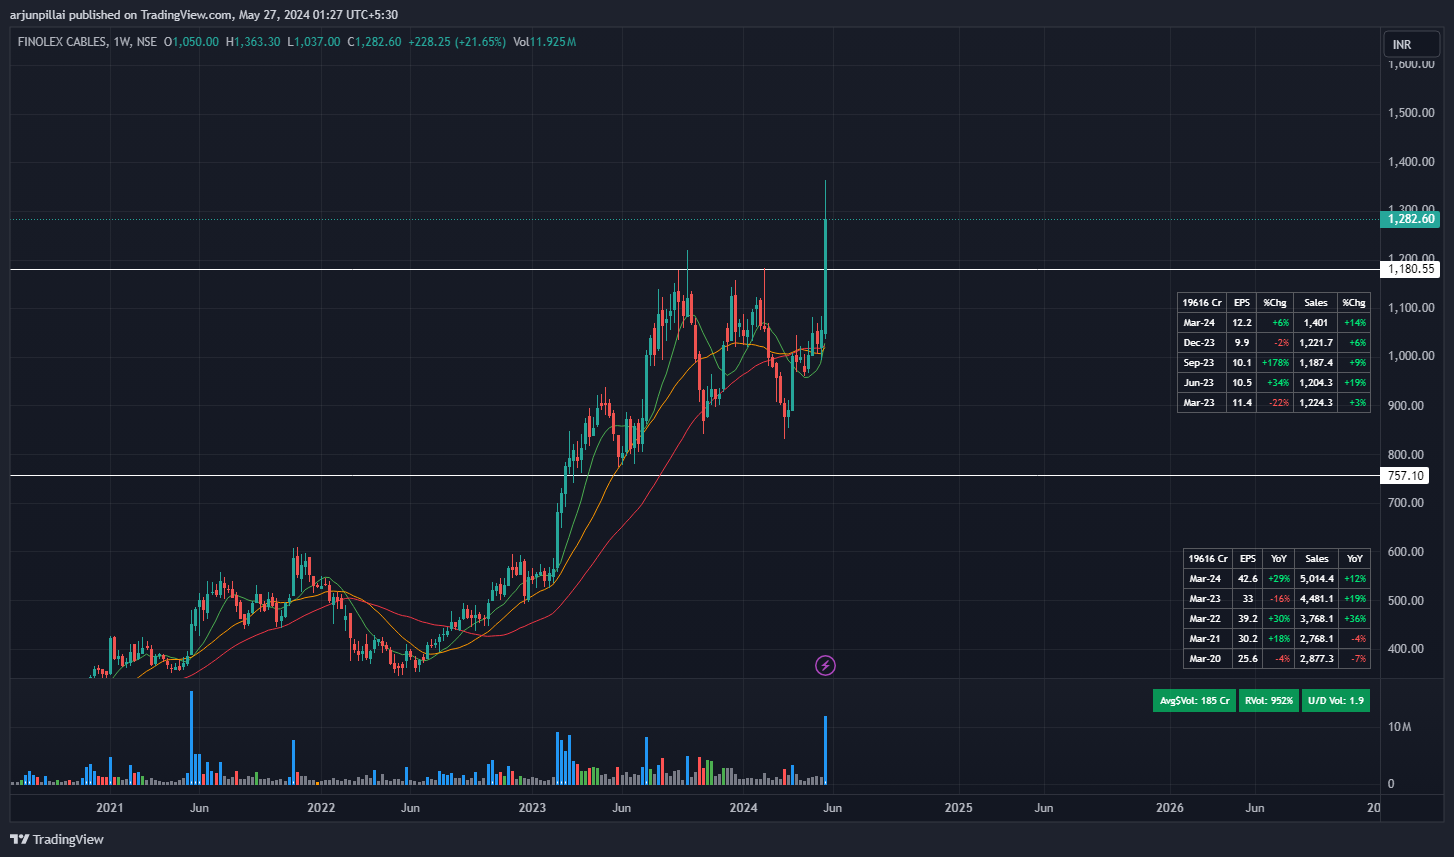
Strong breakout with support of volume.
Revenue of 4481Cr FY23 vs 5014 Cr. FY24 - 👍
PAT of 502 Cr FY23 vs 572 Cr FY24 - 👍
EPS of 32.81 FY23 vs 37.37 FY24 - 👍
Paras Defence and Space Technologies Ltd
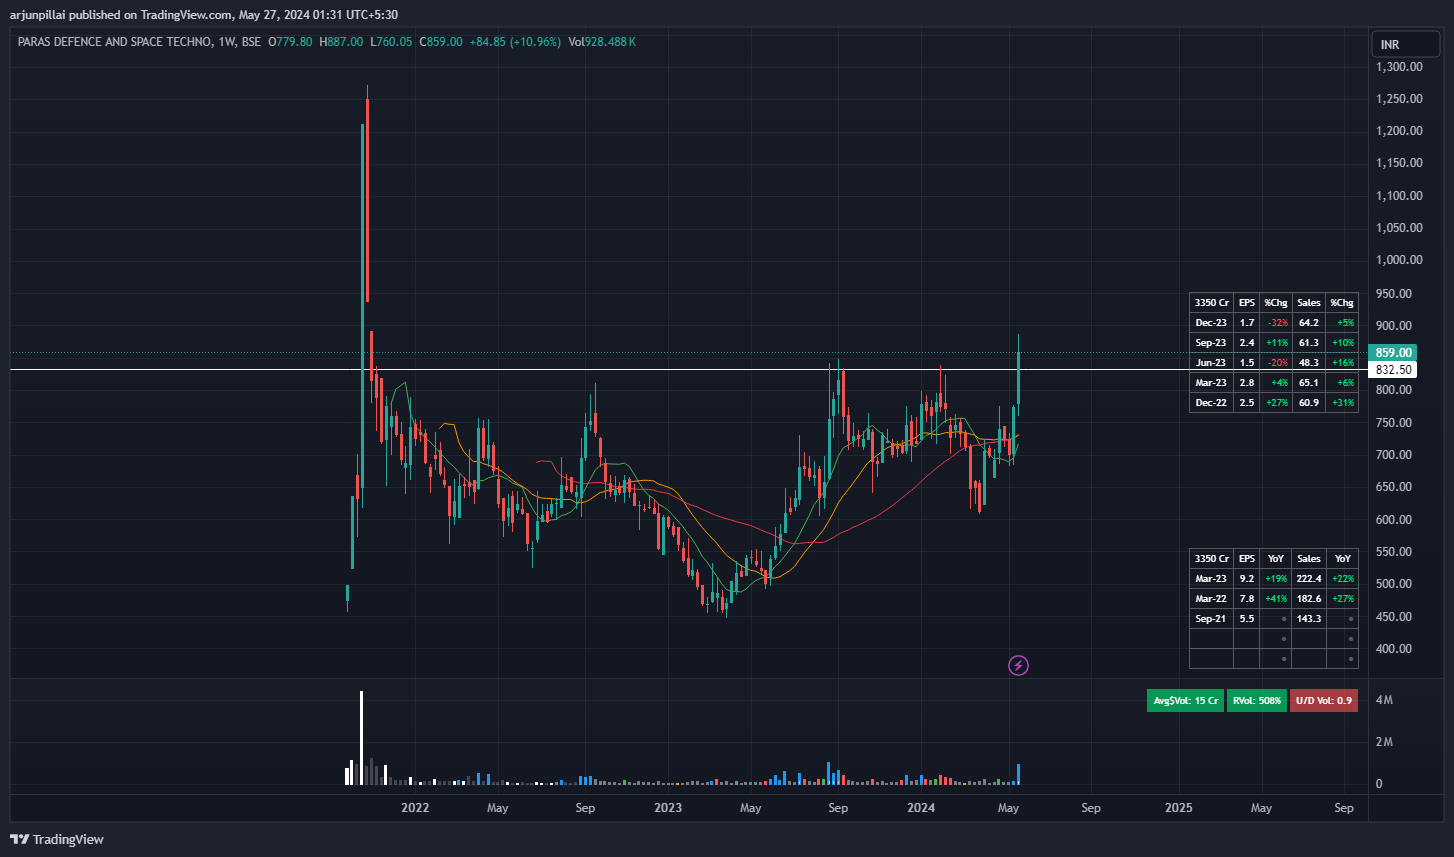
Resistance breakout with significant volume building up.
Revenue of 222 Cr FY23 vs 254 Cr. FY24 - 👍
PAT of 36 Cr FY23 vs 30Cr FY24 - 👍
EPS of 9.25 FY23 vs 8.22 FY24 - 👍
Gokul Refoils and Solvent Ltd

Obeying the trendline and slight volumes picking up and price action looks good
Revenue of 3137 Cr FY23 vs 3186 Cr. TTM - 👍
PAT of 24 Cr FY23 vs 6 Cr TTM - 👎
EPS of 2.44 FY23 vs 0.61 TTM - 👎
Goldstar Power Ltd
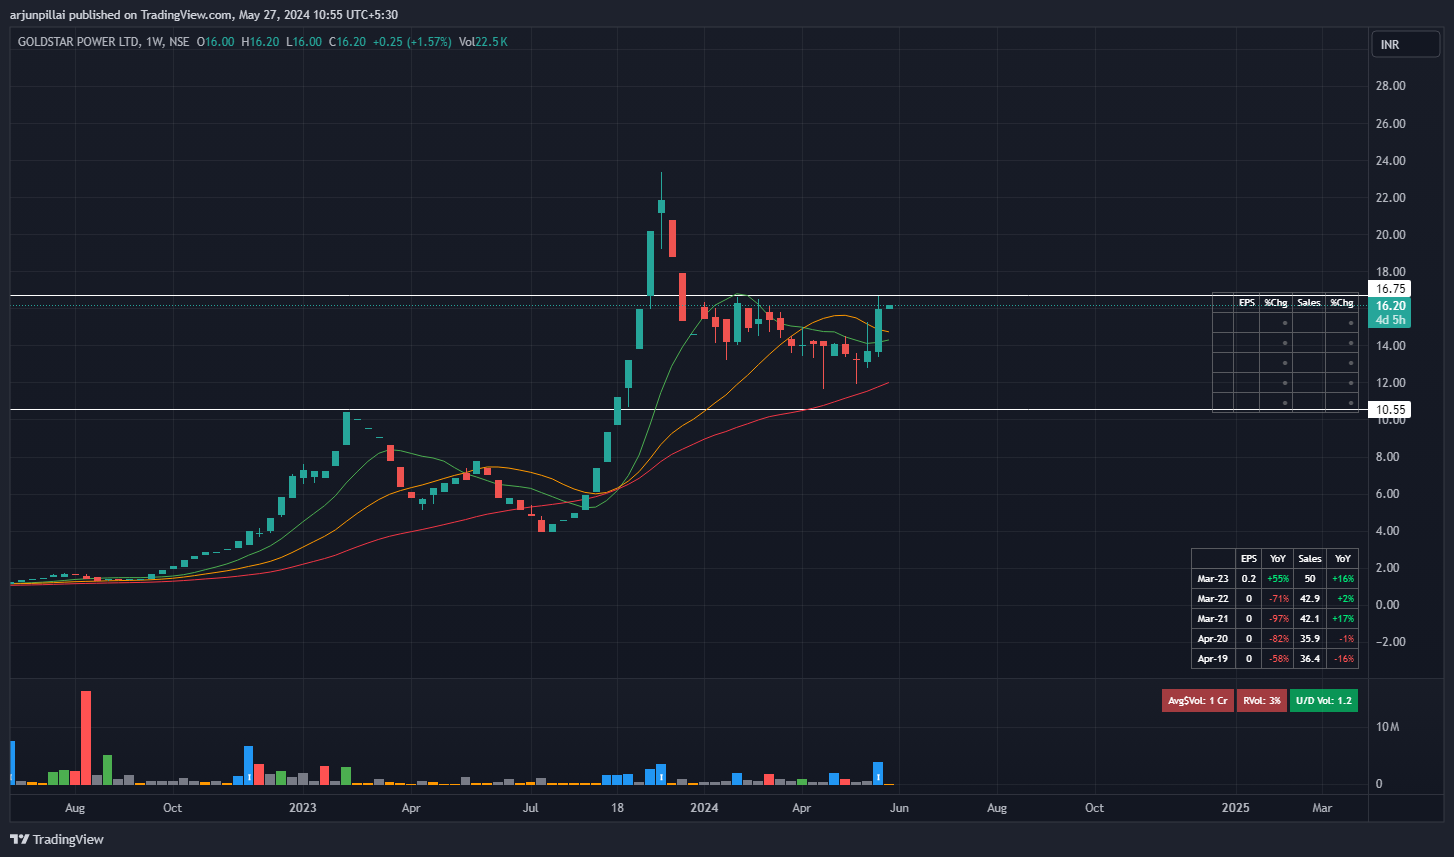
Good strength in price on weekly supported by Volumes.
27th May results would be announced. (Today)
Revenue of 49.98 Cr FY23 vs 43.83 Cr. TTM - 👎
PAT of 3.73 Cr FY23 vs 4.15 Cr TTM - 👍
EPS of 0.15 FY23 vs 0.17TTM - 👍
Baheti Recycling Industries Ltd

Weekly volumes starting to pick up and strength in price is shown.
30th May results would be announced.
Revenue of 248 Cr FY22 vs 358 Cr. FY23 - 👍
PAT of 3 Cr FY22 vs 5Cr FY23 - 👍
EPS of 6.42 FY22 vs 5.09 FY23 - 👎
DCM Shriram Industries Ltd
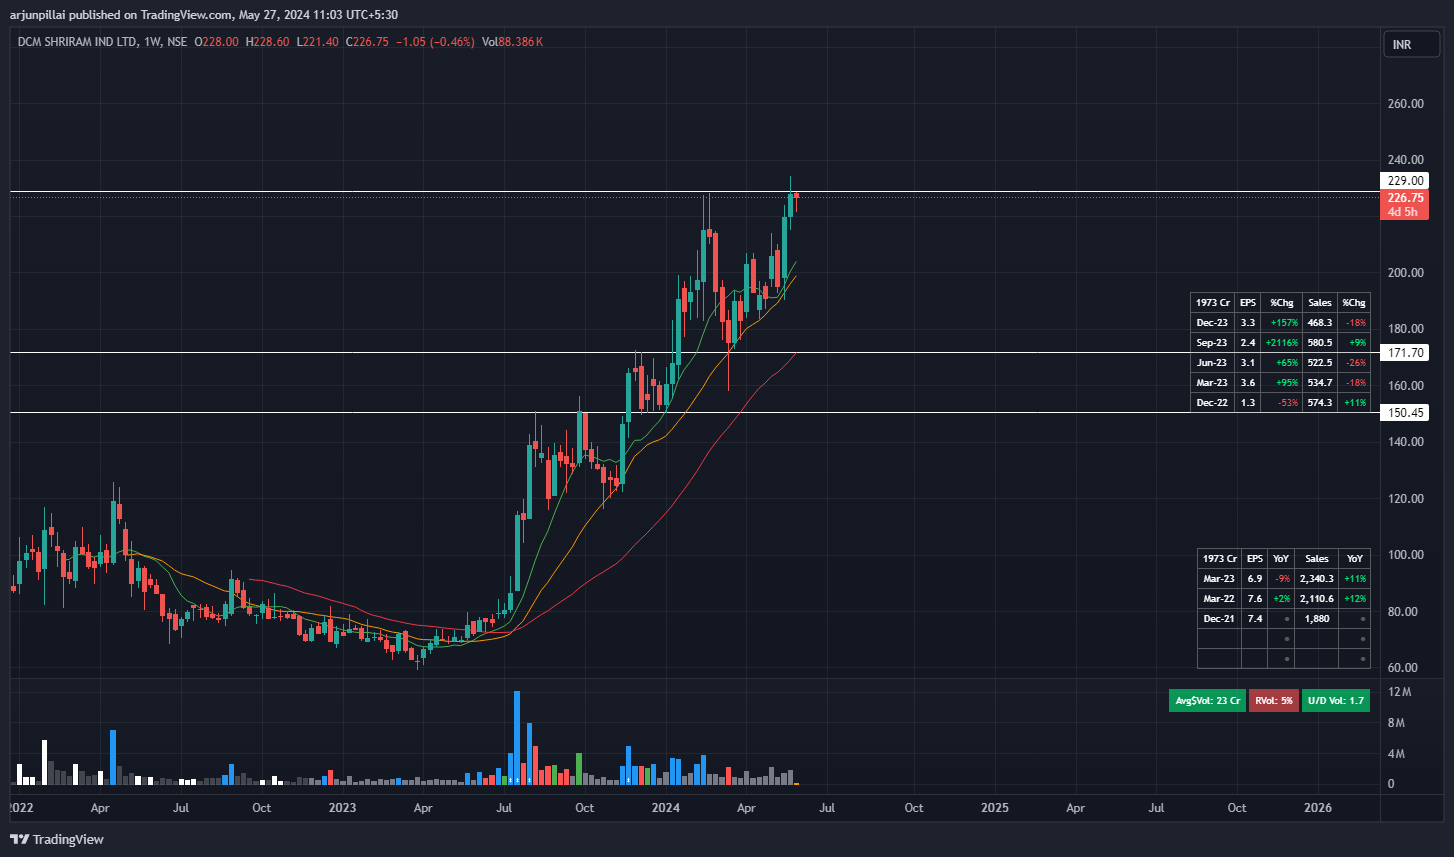
All time high formation.
27th May results would be announced. (Today)
Revenue of 2351 Cr FY23 vs 2106 Cr. TTM - 👎
PAT of 60 Cr FY23 vs 108 Cr TTM - 👍
EPS of 6.92 FY23 vs 12.44 TTM - 👍
PG Electroplast Ltd

Breakout and retest situation supported by huge spike in volumes.
Revenue of 2160 Cr FY23 vs 2746 Cr. FY24 - 👍
PAT of 77 Cr FY23 vs 135 Cr FY24 - 👍
EPS of 34.08 FY23 vs 51.83 FY24 - 👍
Sandhar Technologies Limited

Consolidation range and trading near all time high. Good volumes are picking up on weekly.
Revenue of 2909 Cr FY23 vs 3521 Cr. FY24 - 👍
PAT of 74 Cr FY23 vs 110 Cr FY24 - 👍
EPS of 12.12 FY23 vs 18.24 FY24 - 👍
JNK India Ltd.
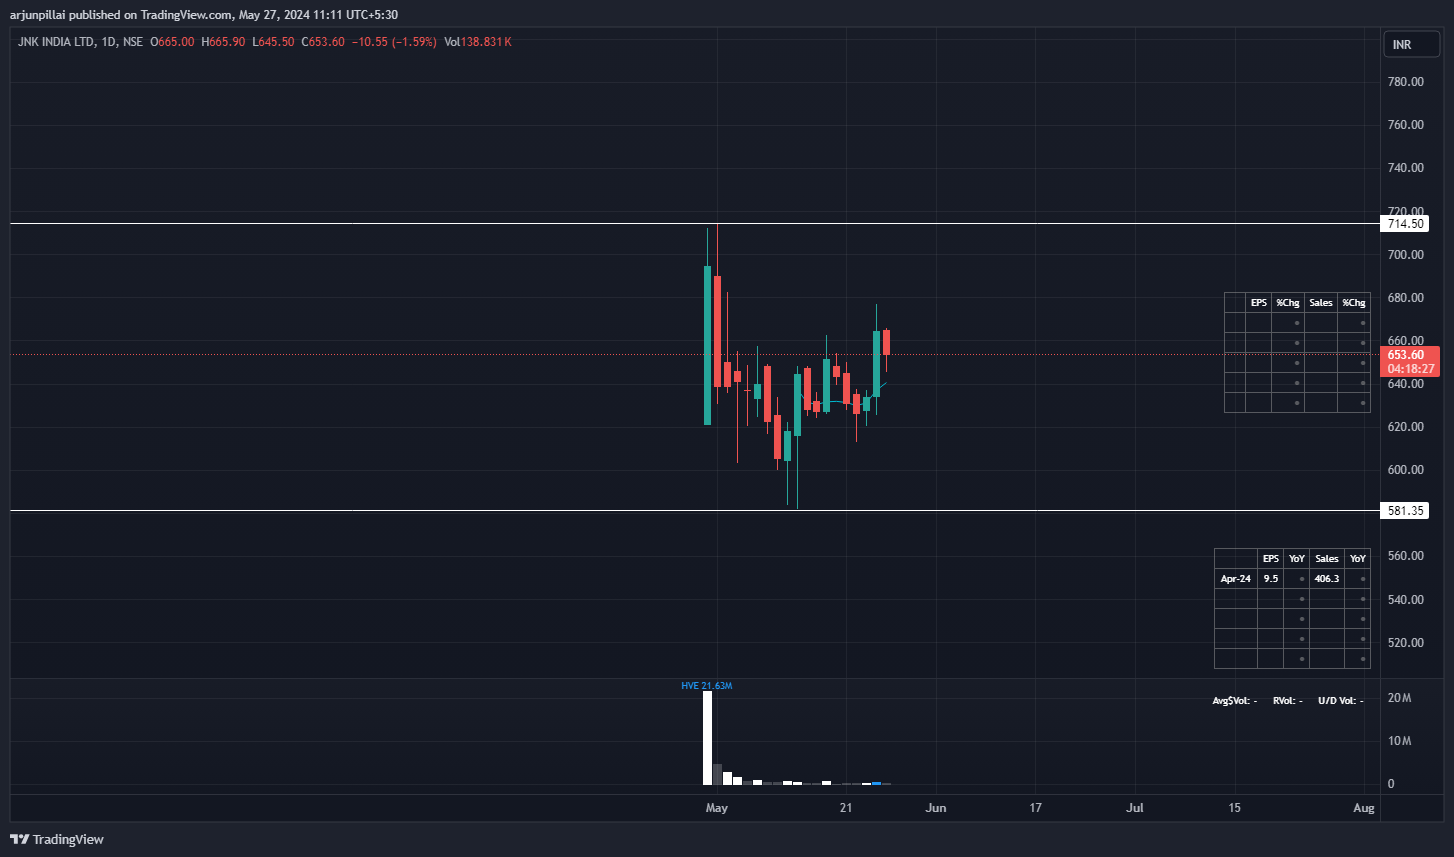
Nothing much on the chart.
30th May results would be announced.
Revenue of 289 Cr FY22 vs 405 Cr. FY23 - 👍
PAT of 36 Cr FY22 vs 47 Cr FY23 - 👍
EPS of 37.45 FY22 vs 48.57 FY23 - 👍
Alankit Ltd

Consolidation range. Good volumes are picking up on weekly.
Revenue of 312 Cr FY23 vs 236 Cr. FY24 - 👎
PAT of (35) Cr FY23 vs 22 Cr FY24 - 👍
EPS of (1.5) FY23 vs 0.8 FY24 - 👍
DISCLAIMER : Please note the above is not a Buy/Sell recommendation, it is purely for just knowledge purposes and understanding Technical analysis and the behavior of the market. This newsletter is by no means is to give you calls or recommendations of any kind. Please learn from the above analysis and don’t copy trade. We are not SEBI registered nor a financial advisor. Thank you. 
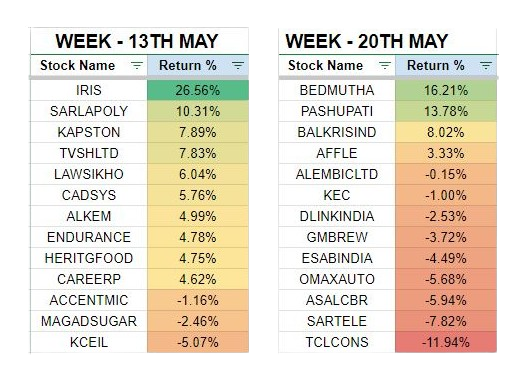
Set of Stock Ideas 💡 given last week on 13th May 2024 & 20th May 2024 performance have been good in the span of 1-2 weeks.
Will be updating weekly on the performance of the stocks given in the previous week and prior to that.
If you enjoyed reading this, learnt something and have any feedback or insights, please share by leaving a comment below 👇
Thank you for reading and keep learning.
Cheers,
Arjun.
Disclaimer : Content shared on or through this article is for information and education purposes only and should not be treated as investment or trading advice. The analysis and insights presented are based on publicly available information, and while efforts have been made to ensure accuracy, we cannot guarantee the completeness or reliability of the information.
Please do your own analysis or take consultation with a qualified financial advisor before making any investments based on your own personal circumstances.
Investment in securities are subject to market risks, please carry out your due diligence before investing. And last but not the least, past performance is not indicative of future returns.
The author of this post and the platform on which it is published do not provide personalized investment recommendations or financial advisory services. Any investment or trading decisions you make based on the information provided in this post are solely at your own risk.
Neither the author nor the platform shall be held responsible or liable for any loss or damage arising directly or indirectly from the use of or reliance on the information contained in this post. Readers are encouraged to conduct their own due diligence and seek professional advice before making any investment decisions.
By accessing and reading this post, you acknowledge and agree to the terms and conditions outlined in this disclaimer.
Subscribe to Contrarian Portfolio
Deep dive analysis on Indian & US listed stocks, Outlook of the market scenario, Research and Analysis on my picks.